Practice 7: Spark MLlib: Analyze Uber Data

In this practice we discover Uber data with SparkSQL and Spark Mllib components. The Uber data could be taken from this source and it has the following structure:
The Uber Data Set Schema
- Date/time: The date and time of the Uber pickup.
- Lat: The latitude of the Uber pickup.
- Lon: The longitude of the Uber pickup.
- Base: The TLC base company affiliated with the Uber pickup.
The Data Records are in CSV format. An example line is shown below:
2014-08-01 00:00:00,40.729,-73.9422,B02598
2014-08-01 00:00:00,40.7476,-73.9871,B02598
2014-08-01 00:00:00,40.7424,-74.0044,B02598
2014-08-01 00:00:00,40.751,-73.9869,B02598
2014-08-01 00:00:00,40.7406,-73.9902,B0259
1. Load Uber Data to SparkSQL DataFrame
a) Define the model of Uber data
case class Uber(dt: String, lat: Double, lon: Double, base: String) extends Serializable
b) Initialize SparkSession and load data to DataFrame:
    //Initialize SparkSession
    val sparkSession = SparkSession
      .builder()
      .appName("spark-uber-analysis")
      .master("local[*]")
      .getOrCreate();

    val uberDataDir = args(0)

    val schema = StructType(Array(
      StructField("dt", TimestampType, true),
      StructField("lat", DoubleType, true),
      StructField("lon", DoubleType, true),
      StructField("base", StringType, true)
    ))

    //Load Uber Data to DF
    val uberData = sparkSession.rea
      .option("header", "true")
      .option("inferSchema", "false")
      .schema(schema)
      .csv(uberDataDir)
      .as[Uber]

    uberData.show()
    uberData.printSchema()
2) Analyze Uber Data by SparkSQL
1) Get the list of companies with have the highest count of trips
2) Get the dates with the highest count of trips
3) Analyze Ubers' Spatial Hotspots (Clusters)
K-means is one of the most commonly used clustering algorithms that clusters the data points into a predefined number of clusters (k). Clustering using the K-means algorithm begins by initializing all the coordinates to k number of centroids. With every pass of the algorithm, each point is assigned to its nearest centroid based on some distance metric, which is usually Euclidean distance. The centroids are then updated to be the “centers” of all the points assigned to it in that pass. This repeats until there is a minimum change in the centers.
In this example, we will discover the clusters of Uber data based on the longitude and latitude, then we will analyze the cluster centers by date/time.
a) Define Features Array
In order for the features to be used by a machine learning algorithm, the features are transformed and put into Feature Vectors, which are vectors of numbers representing the value for each feature. Below, a VectorAssembler is used to transform and return a new DataFrame with all of the feature columns in a vector column.
    // Get Feature Vectors
    val featureCols = Array("lat", "lon")
    val assembler = new VectorAssembler()
      .setInputCols(featureCols)
      .setOutputCol("features")

    val uberFeatures = assembler.transform(uberData)
b) Train KMeans model
Next, we create a KMeans object, set the parameters to define the number of clusters and the maximum number of iterations to determine the clusters, and then we fit the model to the input data.
//Split data into training and testing data
val Array(trainingData, testData) = uberFeatures.randomSplit(Array(0.7, 0.3), 5043)
//Traing KMeans model
val kmeans = new KMeans()
.setK(20)
.setFeaturesCol("features")
.setMaxIter(5)
val model = kmeans.fit(trainingData)
println("Final Centers: ")
model.clusterCenters.foreach(println)
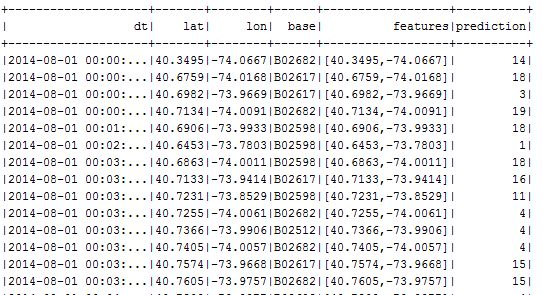
//Get Predictions
val predictions = model.transform(testData)
predictions.show
c) Further Analyzing
Next, we use the model to get the clusters for test data in order to further analyze the clustering.
a) Which hours of the day and which cluster had the highest number of pickups?
      predictions.select(hour($"dt").alias("hour"), $"prediction")
      .groupBy("hour", "prediction").agg(count("prediction")
      .alias("count"))
      .orderBy(desc("count"))
      .show
d) Visualize Spatial Uber Hotspots by Leafleat.js
Save the points of some particular cluster in JSON file:
val res = sparkSession.sql("select dt, lat, lon, base, prediction as cid FROM uber where prediction = 1")
res.coalesce(1).write.format("json").save("./data/uber.json")
Prepare the json file with the points:
var markers = [
{"dt":"2014-08-01T00:02:00.000+04:00","lat":40.6453,"lon":-73.7803,"base":"B02598","cid":1},
{"dt":"2014-08-01T00:06:00.000+04:00","lat":40.6457,"lon":-73.7767,"base":"B02617","cid":1},
{"dt":"2014-08-01T00:42:00.000+04:00","lat":40.6465,"lon":-73.7897,"base":"B02682","cid":1},
{"dt":"2014-08-01T00:46:00.000+04:00","lat":40.6733,"lon":-73.8334,"base":"B02617","cid":1},
{"dt":"2014-08-01T00:48:00.000+04:00","lat":40.6654,"lon":-73.7706,"base":"B02682","cid":1},
{"dt":"2014-08-01T01:21:00.000+04:00","lat":40.6447,"lon":-73.7819,"base":"B02682","cid":1},
{"dt":"2014-08-01T04:19:00.000+04:00","lat":40.6461,"lon":-73.7768,"base":"B02682","cid":1},
{"dt":"2014-08-01T04:29:00.000+04:00","lat":40.6456,"lon":-73.7766,"base":"B02617","cid":1}
];
